1. What is your gender?
Female: 16
Male: 14
In conclusion female filled out the most questionnaires, however the documentary is going to be aimed at both sexes.
2. What age group are you?

In conclusion the majority of the people who filled out the questionnaire where young teenagers between the ages of 14-17, This age group is going to be the target audience for our documentary.
3. What is your favourite colour?
In conclusion to the results shown, the vast majority of people had chosen that their favourite colour was green, followed by red, hopefully this will give my group a good idea of what colours we will be using for our documentary for example the colour of the title.
4. What channels do you watch the most? According to the pie chart the television channel which is mostly watched is channel four, this gives my group the decision that we will be broadcasting our documentary on channel 4 as it is the popular channel which is watched the most.
5. What times do you watch TV? In conclusion to the bar chart, the times which people watch television the most is at Post watershed time, this is programmes which are programmed after nine o’clock. But because my group have decided to have the target audience at a younger age, we have decided to film our documentary at peak time but a little bit later in the evening before nine o’clock.
6. What is your favourite music?  According to the pie chart the most popular genre of music which people prefer is dance which is then followed by Indie.
7. What does subculture mean to you? According to the pie chart, the people who we filled out our questionnaires nearly 50% of the people did not know what it meant, but 12 out of 30 people got it right as it means different types of social groups.
8. What is your favourite band Favourite band?
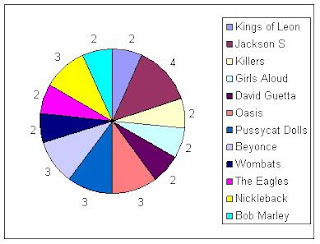
In conclusion to the pie chart, there are a lot of different bands which people chose as their favourite. As there is many different types of people from different groups, people have completely different tastes of music to each over. Over all in conclusion, Jackson five was the most favourite band.
9. Where do you socialise?

In conclusion to the pie chart, a quarter of people chose socialising at mates houses where mostly where socialised then followed by college.
10. Which clothes shops do you use regularly?

In conclusion to the pie chart, people mostly shopped at Primark then followed by Republic,
11.Have you ever felt pressure to conform to a social group?
Yes: 20
No:10
In conclusion 60% of people on the questionnaire truly said that they have never felt peer pressured amongst a group of people, but the other 30% of people admitted to
being peer pressured at some stage of their life. However people could not be telling the truth therefore this could not be valid.
12.What 3 words would you use to describe each of the following?
PUNKS On our questionnaire results people had different opinions towards each subculture they said that punks was describes as
Abnormal
Music
Piercings
Crazy hair
Geeks
Colourful
Stripes
Boots
Calm
jeans
EMOS where described as
Makeup
Music
Depressed
Fringes
Eyeliner
Smelly
Sweaty
Greasy
Skull
Goths where described as
Black
Rock
Music
Bad
Weird
Processed
Devil
Death
Crazy
Silly
Monster
Scallies where described as
Tracksuits
Crime
Gold chains
Cider
Ale
Fire
Drugs
Wanna bees
Police
Slang
Swearing
jail
In conclusion different people have very different views towards the different subculture groups in society
No comments:
Post a Comment